
Growing, Greening, Gassifying: Evolving US Electricity Generation in Eight Charts
Generation up, emissions down, coal and gas trading places

Growing, Greening, Gassifying
US electricity generation is up, power sector emissions are down, and the grid is getting greener—and gassier. In 2022 the US burned more natural gas than ever, cut coal generation to post-Covid lows, and produced record amounts of zero-emissions electricity.
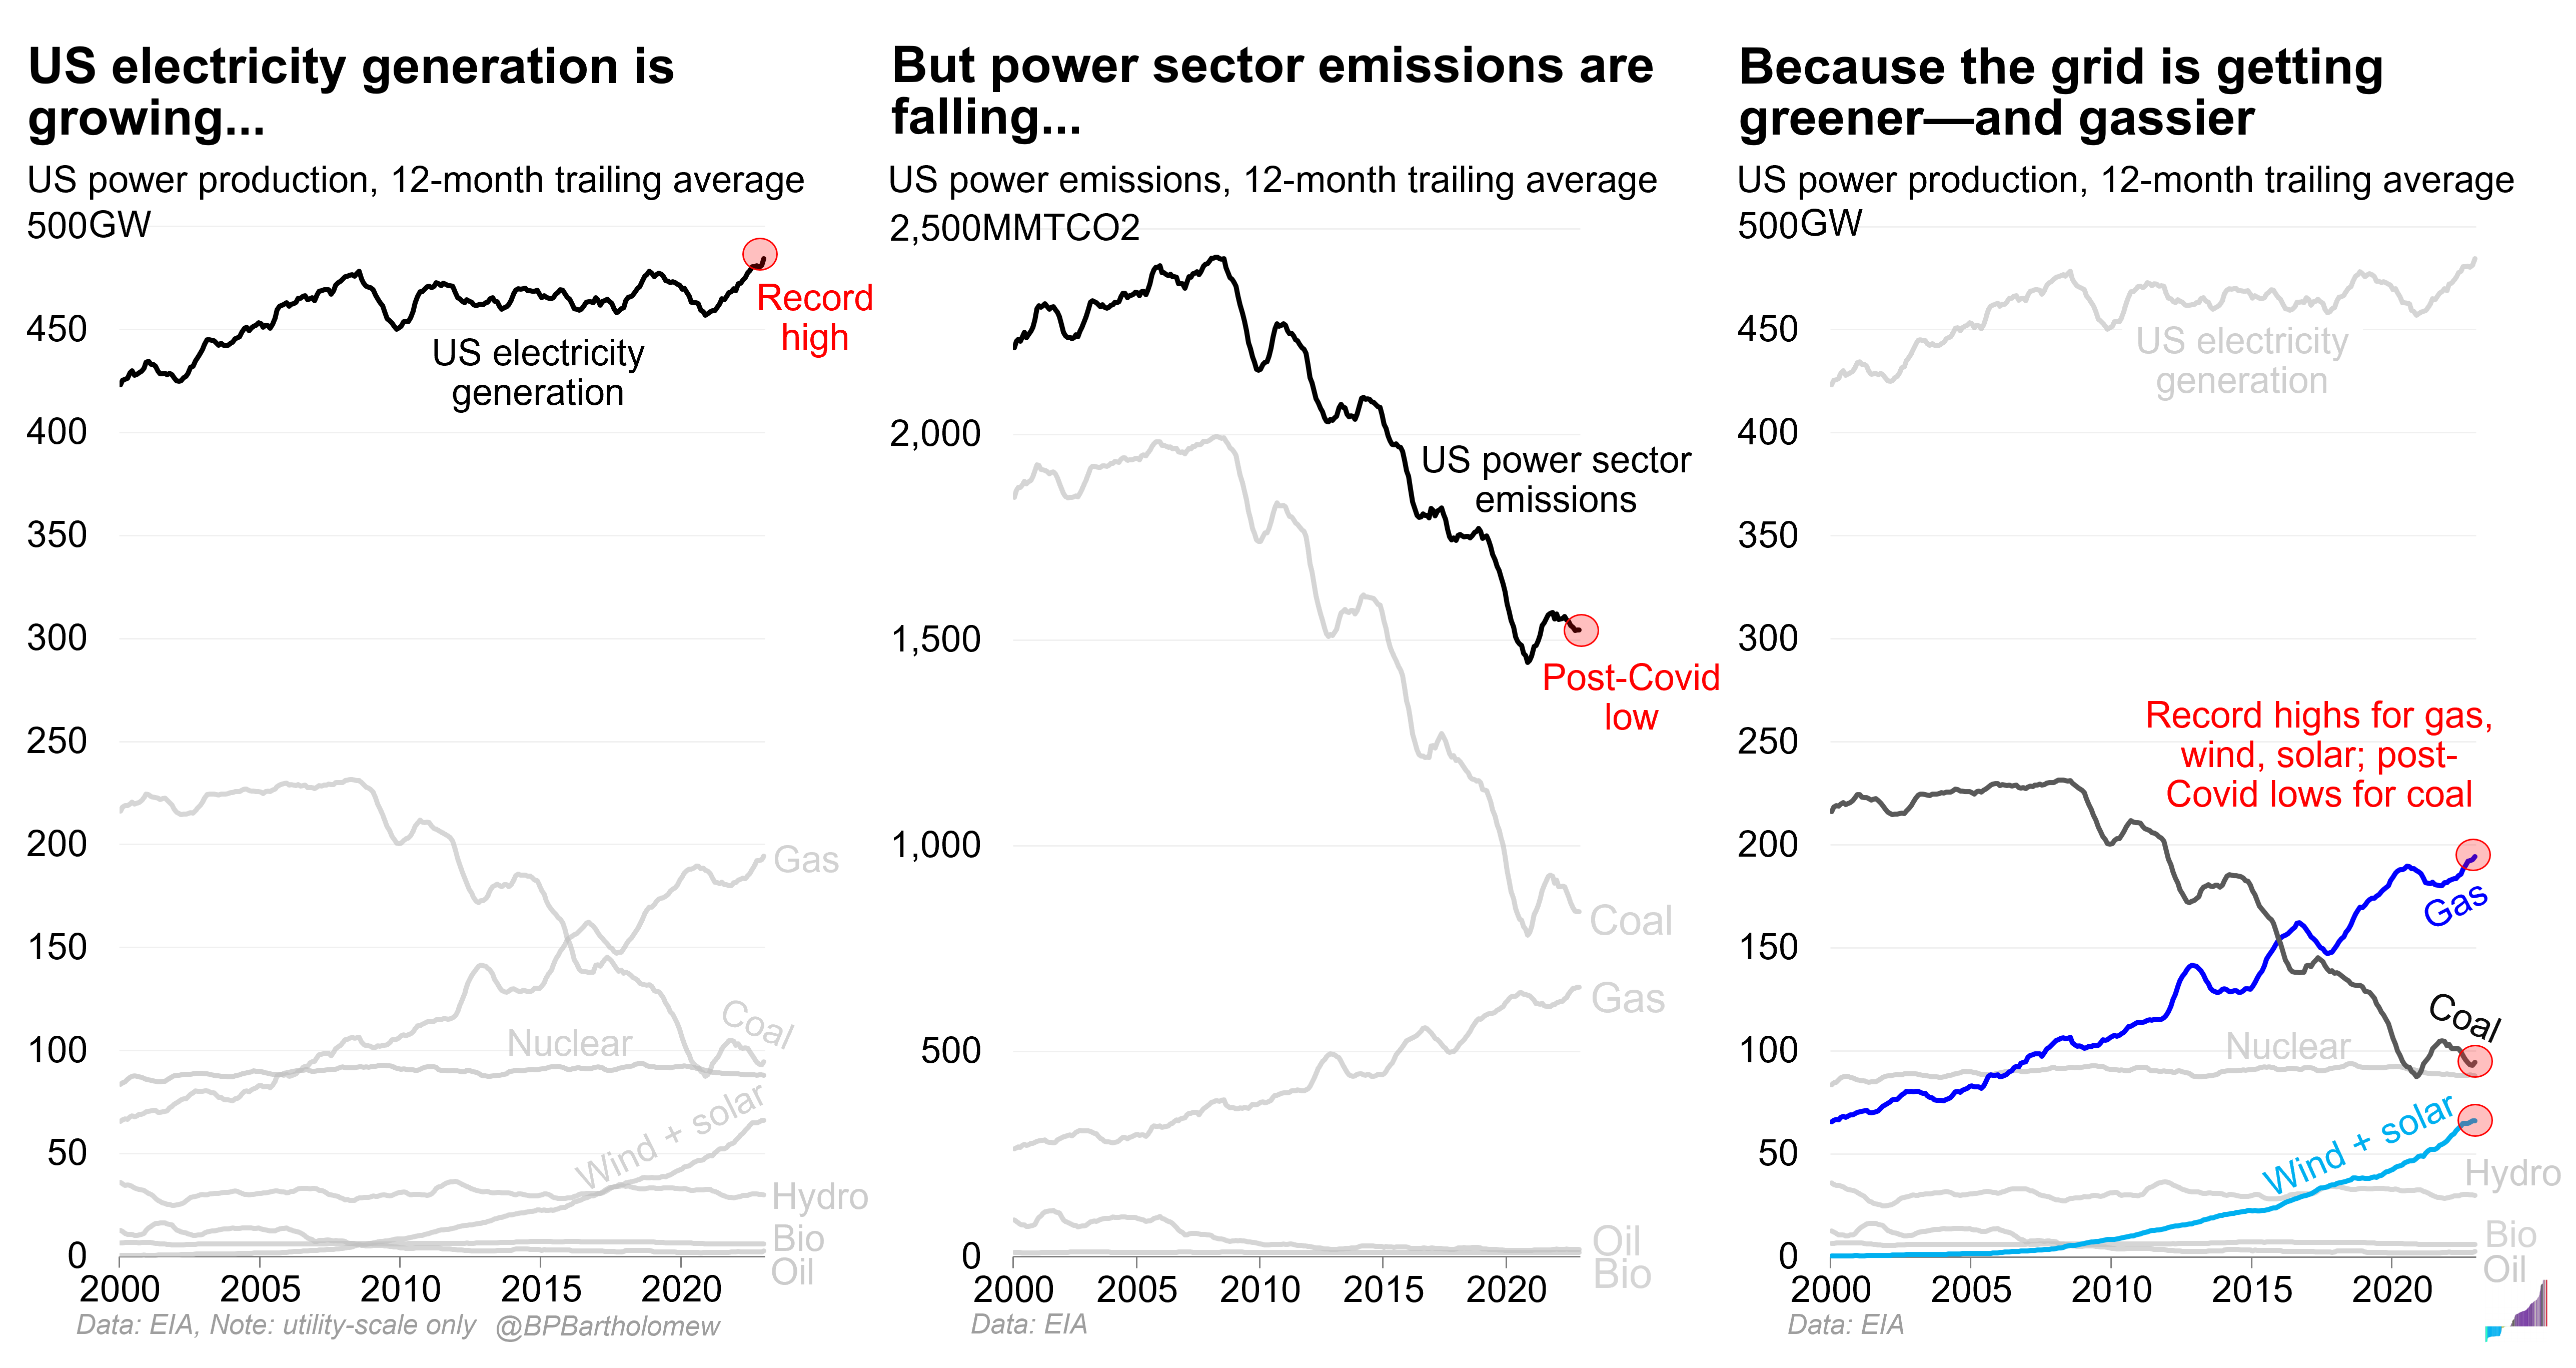
US electricity demand jumped to record highs in 2022 on a mix of structural trends and extreme temperatures. Despite that, emissions from electricity generation were down 37% from their 2007 peak. Power sector emissions are falling past levels seen in the 1980s, when then US produced around half as much electricity as it does today.1
Fossil fuels still supply the bulk of utility-scale generation, but their share is shrinking, and the composition has changed, from mostly coal to mostly gas. Natural gas is less than half as emissions-intensive as coal; the shift from coal to gas has produced a steep drop in power sector emissions.

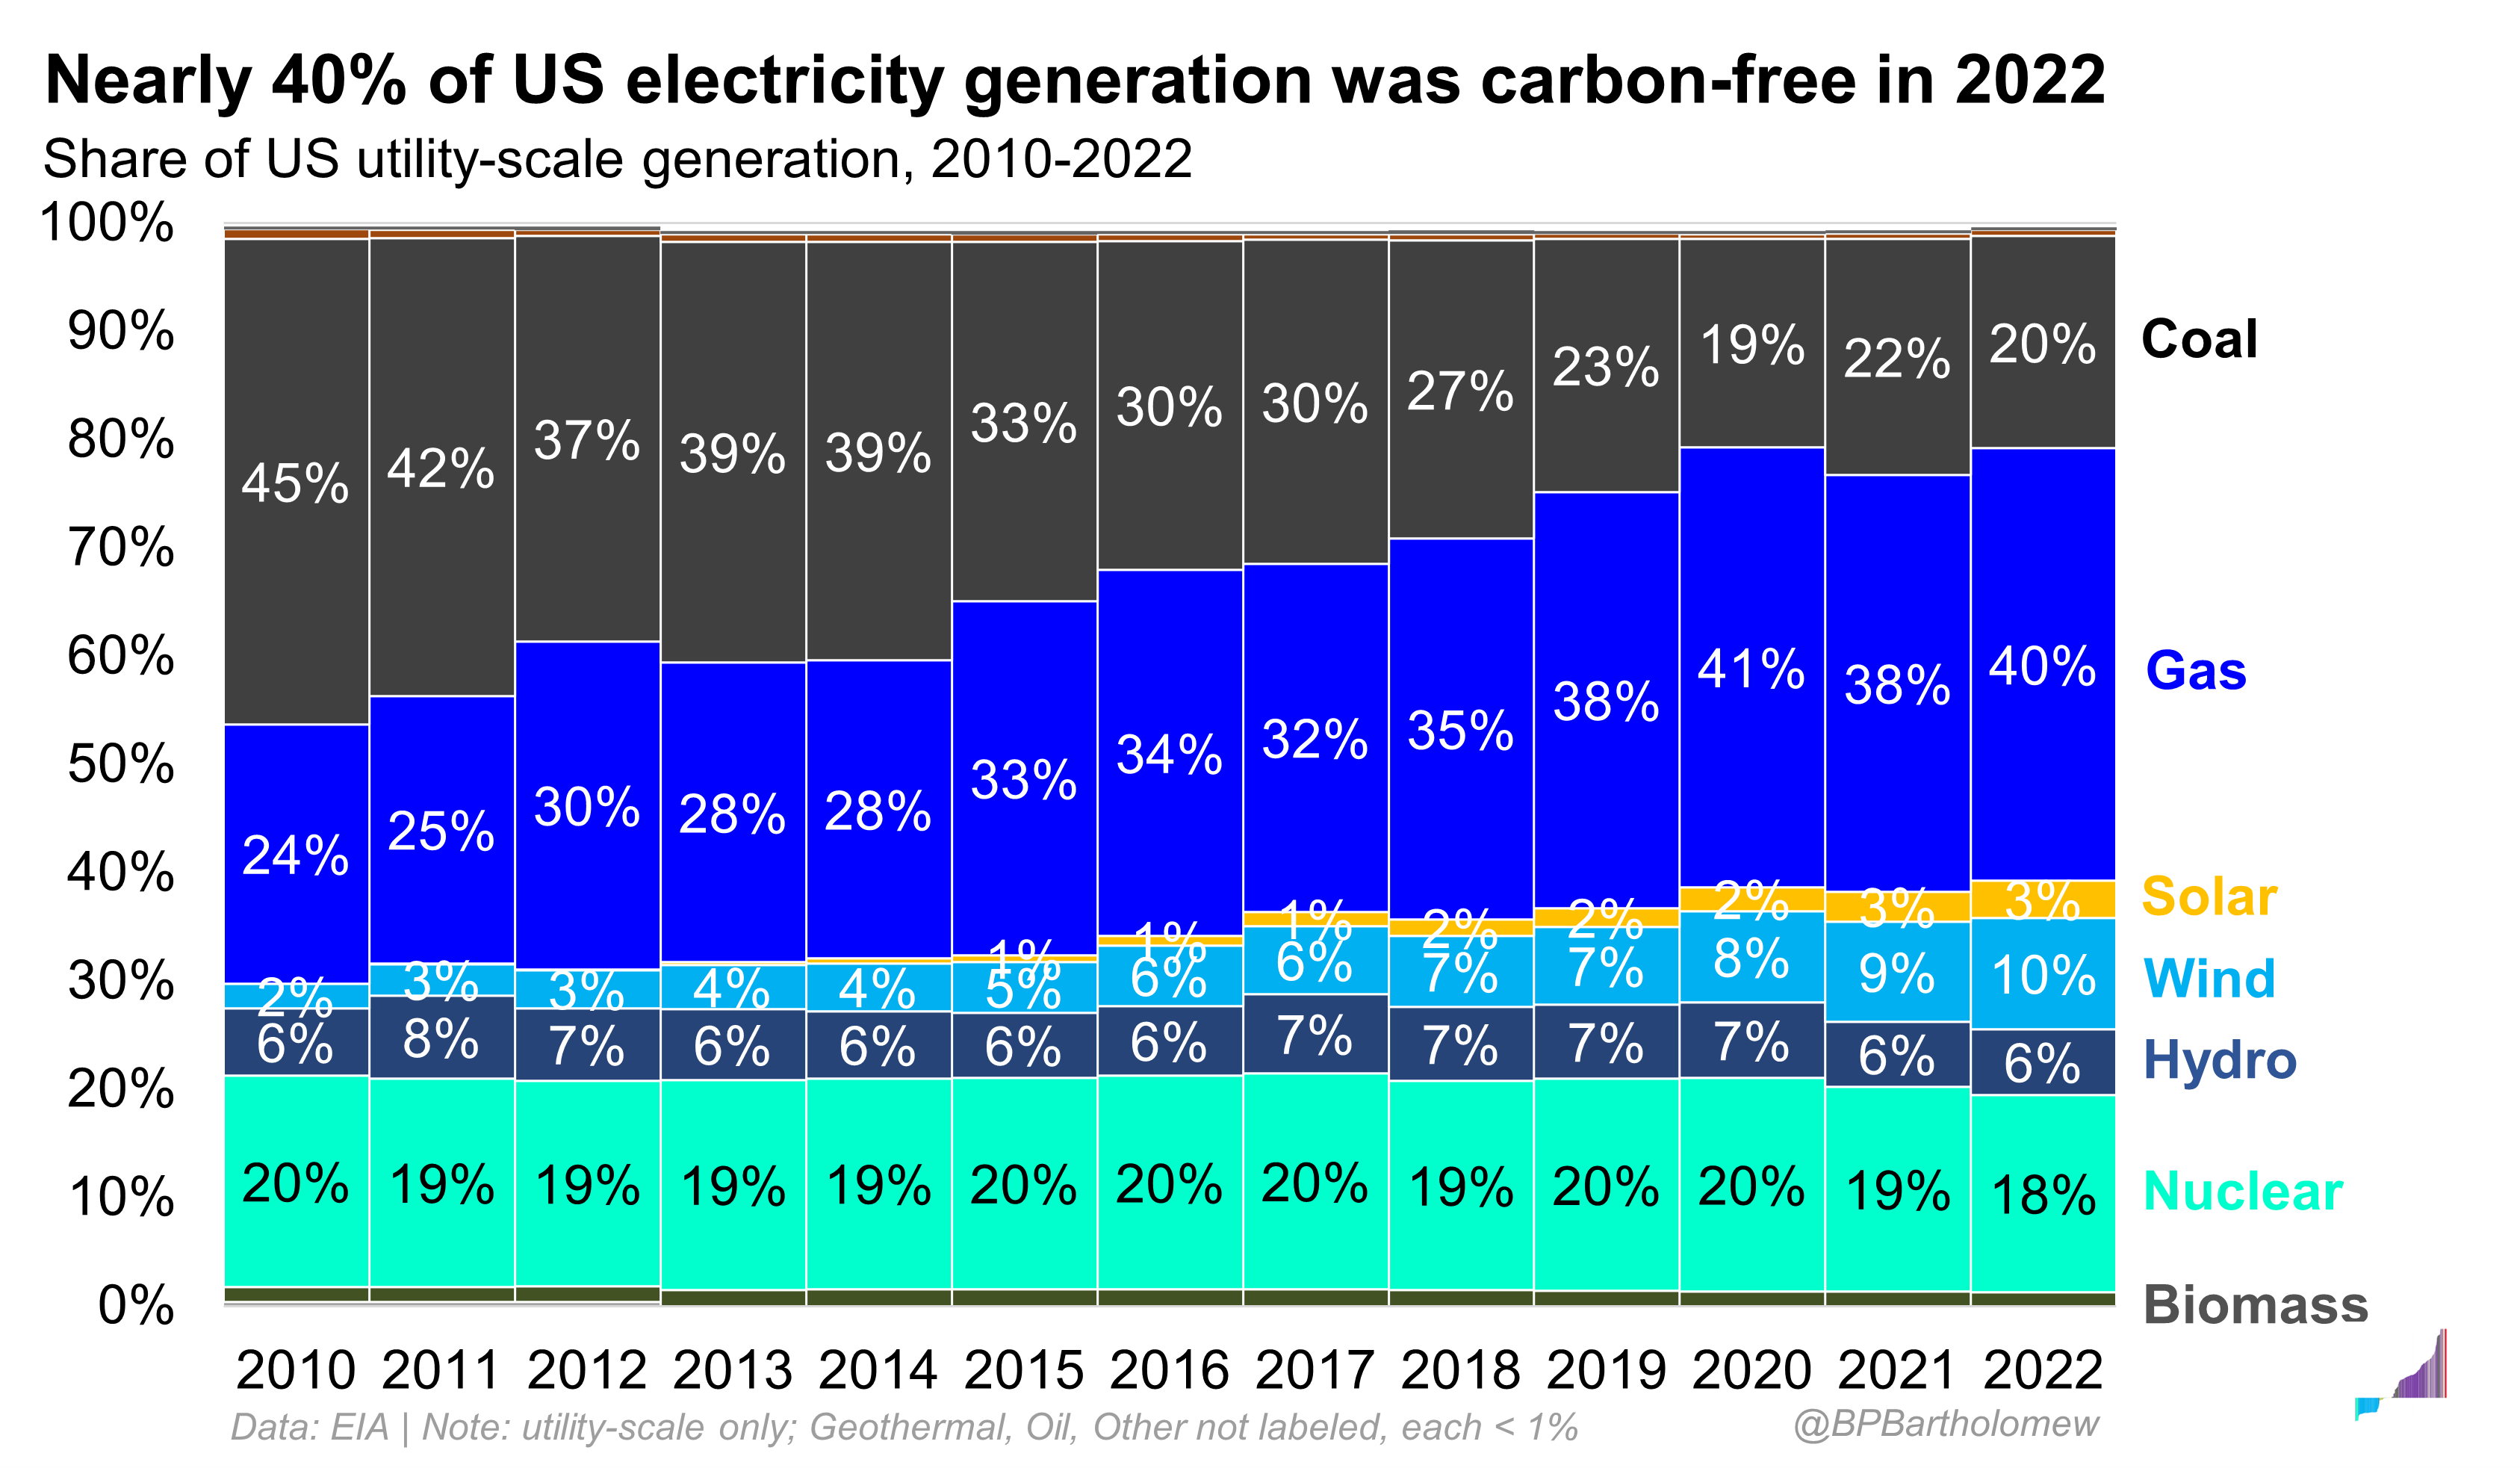
Forty percent carbon-free
Nearly 40% of large-scale US generation was carbon-free in 2022, coming from a mix of legacy nuclear and hydro and growing wind and solar. Nuclear power remains the single largest sources of emissions-free electricity today, supplying 18% of generation. Wind, solar, and hydro now produce 20% of all utility-scale generation. Fossil fuels round out the remainder of the power mix, but the relative shares of coal and gas have flipped, making for a much less emissions- and pollution-intensive thermal fleet than the one inherited even just a decade ago.
No Country for Coal Gen
Lower-cost natural gas and growing renewable penetration have punished coal plant economics. Coal generation in 2022 was down more than half from its mid-aughts peak, with no end in sight for further declines. Even recent higher power and gas prices have been unable to stall ongoing waves of coal plant retirements, which are cementing coal’s declining share in the power mix.

Trading Places
Natural gas generation has more than doubled since 2006 on the back of low-cost US shale production and at the expense of coal. Natural gas first overtook coal as the largest source of US generation in 2015; it now produces twice as much electricity as coal-fired plants. The secular transition from coal to natural gas is still punctuated by cyclical swings between the two, depending on short-term fuel prices. Over time, operational fuel-switching from existing coal to gas is made permanent by retirements and new build. As more coal retires, it provides less and less capacity to ease strain not just on power but also on natural gas fuel supplies.

Renewable generation surpasses coal, nuclear
The US produced more electricity from renewables than from coal in 2022, a first in the modern era. Wind surpassed hydro as the largest single source of renewable generation near the turn of the decade.

Don’t You (Forget About Me)
While new US nuclear build remains fraught, existing nuclear plants remain the largest single source of emissions-free electricity today, supplying just under half of all carbon-free generation.

Zero-emissions generation now 2x coal, chasing gas
Combined zero-emissions electricity from nuclear, wind, solar, and hydro made up 37% of utility-scale generation in 2022, nearly twice as much electricity as produced from coal. As early as this year, zero-emissions generation could overtake natural gas in the US power mix.

Related reading
For a free-to-read, wider-lens look at US energy in 2022, see the Sustainable Energy in America Factbook from BloombergNEF and the Business Council on Sustainable Energy and Nat Bullard’s write-up of that report here.
Recent posts
Texas now produces nearly twice as much electricity from renewables as from coal
Wind, solar, and batteries make up nearly 80% of new US power capacity
Texas generated record electricity from renewables, natural gas in 2022
Production shown as average power production (generation in Wh / hours per year). The amounts are the same, but average power production (W) is more relatable than generation (Wh) when comparing to nameplate capacity (also in W) and across time scales (average power last month, today, in the next hour, in the next five minute interval, all in W).
“No country for coal gen” made my day. Thanks for these insights!!
Curious how nuclear will continue to impact overall power mix given gov incentives, DOE’s focus on it, and early days of SMR dev.
Hi Brian. These are some very beautifully designed charts. However, I can't find any corresponding data produced by the EIA that would express generation using a capacity measure, GW. All your charts use the word "generation." But your chosen unit of account is "GW."
Your first chart, for example, portrays total US power generation as traveling along between 450 and 500 GW. There is no data from EIA that confirms this measure. All generation data from EIA is expressed in hours, like MWh, which of course can be easily translated to GWh or TWh. The US power system has been traveling along for years now, producing around 4000 TWh per year. Again, as someone who has used EIA data for 20 years, I am not aware of expressing generation using a capacity unit (whether MW, GW, or TW).
The same observation applies to all your other charts. The coal chart for example, again, expressing generation at a high of 231 GW and the current low at 95 GW. Doesn't correspond to any EIA data.
Can you explain?