
Saturday Grid Coffee
Seams, splits, and double ducks

More or less what it seams
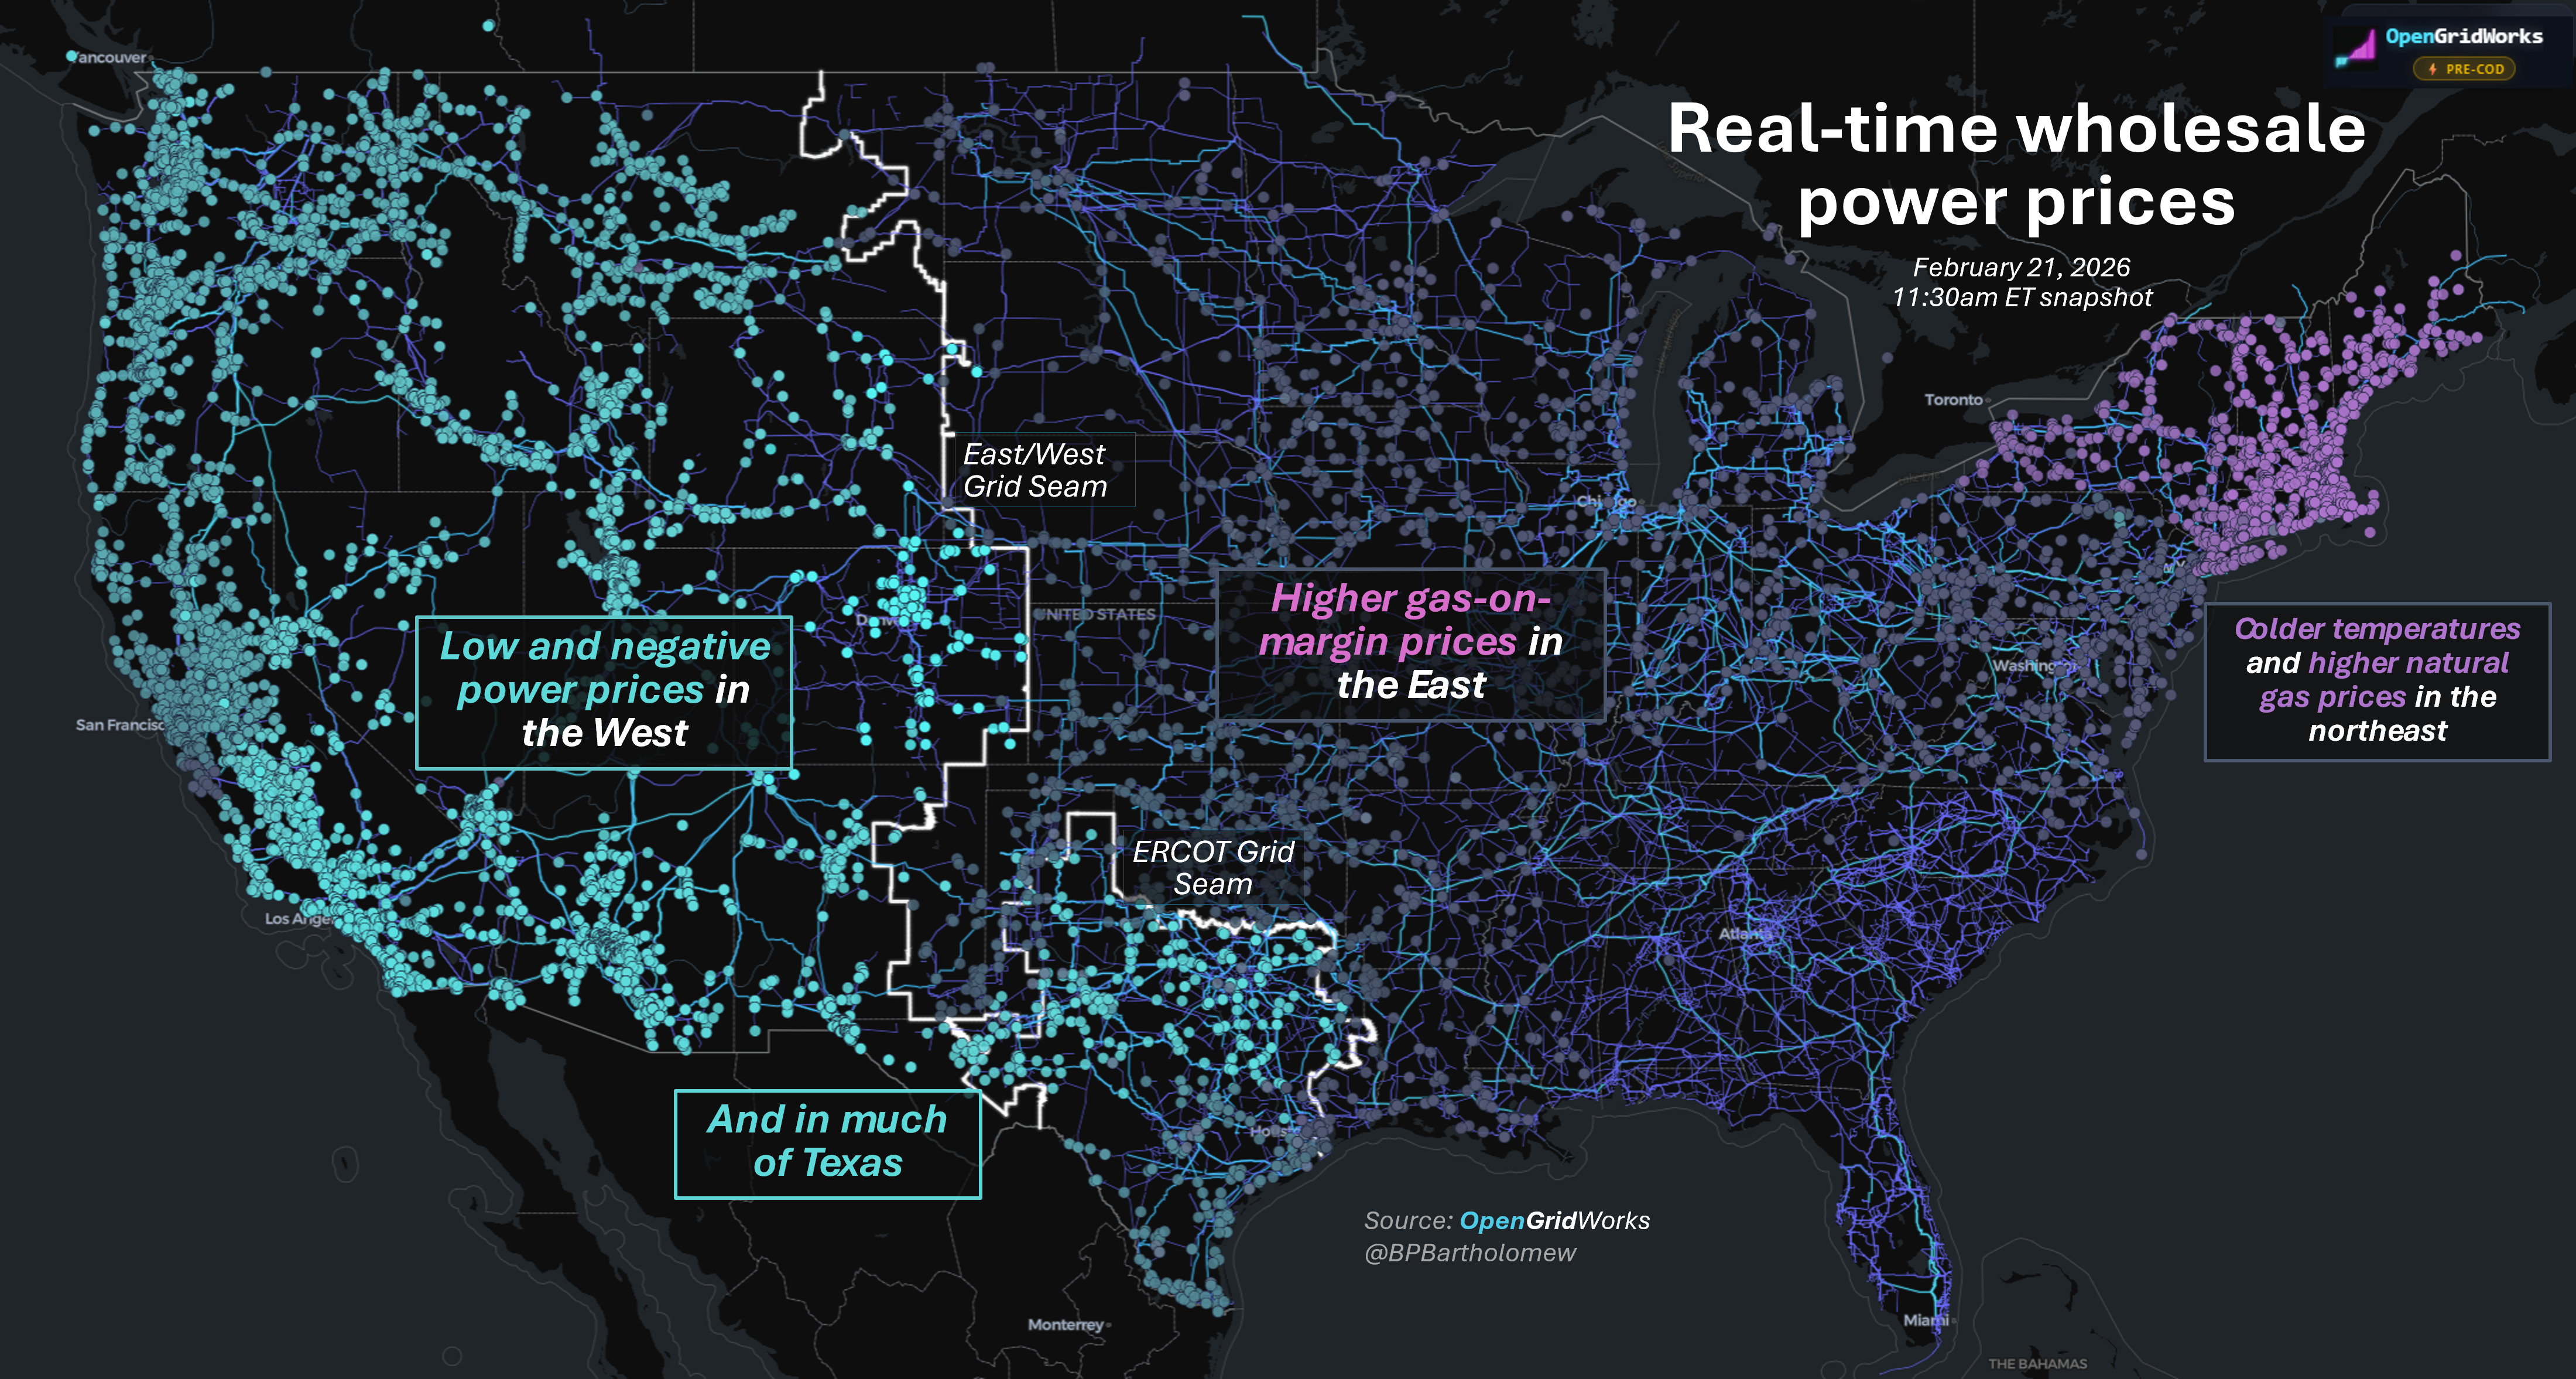
The divides between the three US grids or ‘seams’ are on full display this morning.
There’s free and negative pricing for wholesale electricity across the west and most of Texas, and higher prices just on the other side in the east.
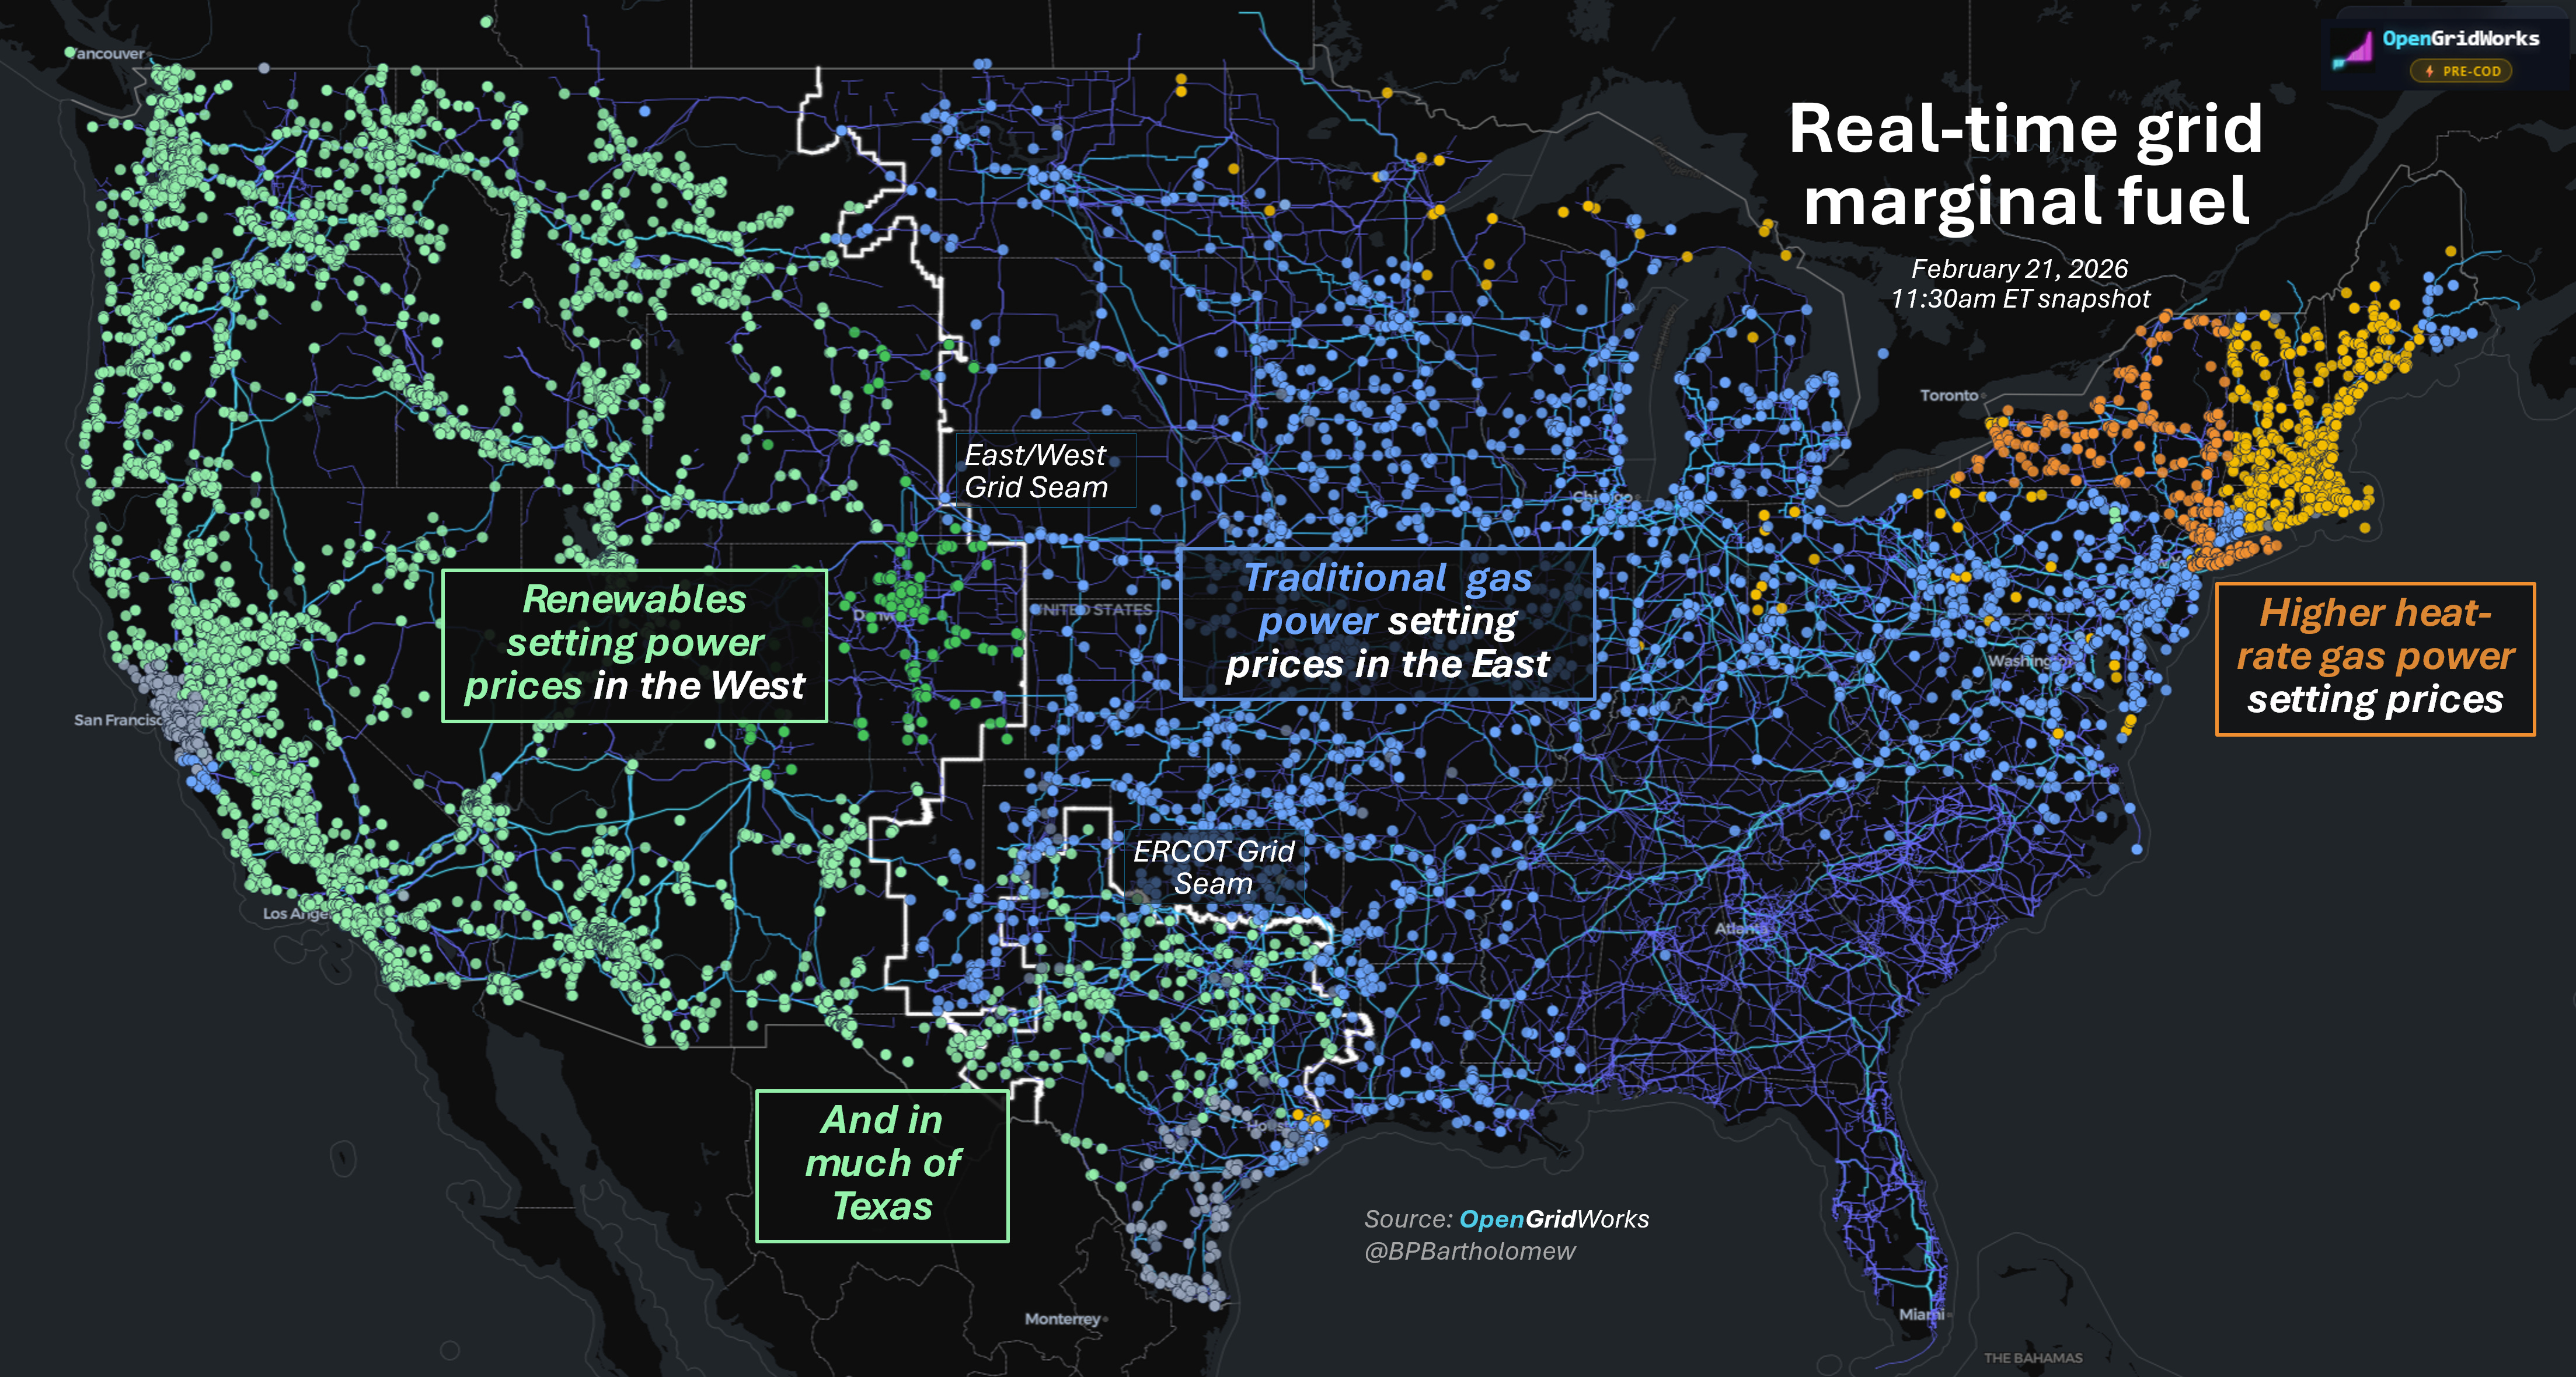
This map below is another way to look at what prices are telling us—renewables are setting power prices in the west and ERCOT, and natural gas heat rate math is driving prices in the east.
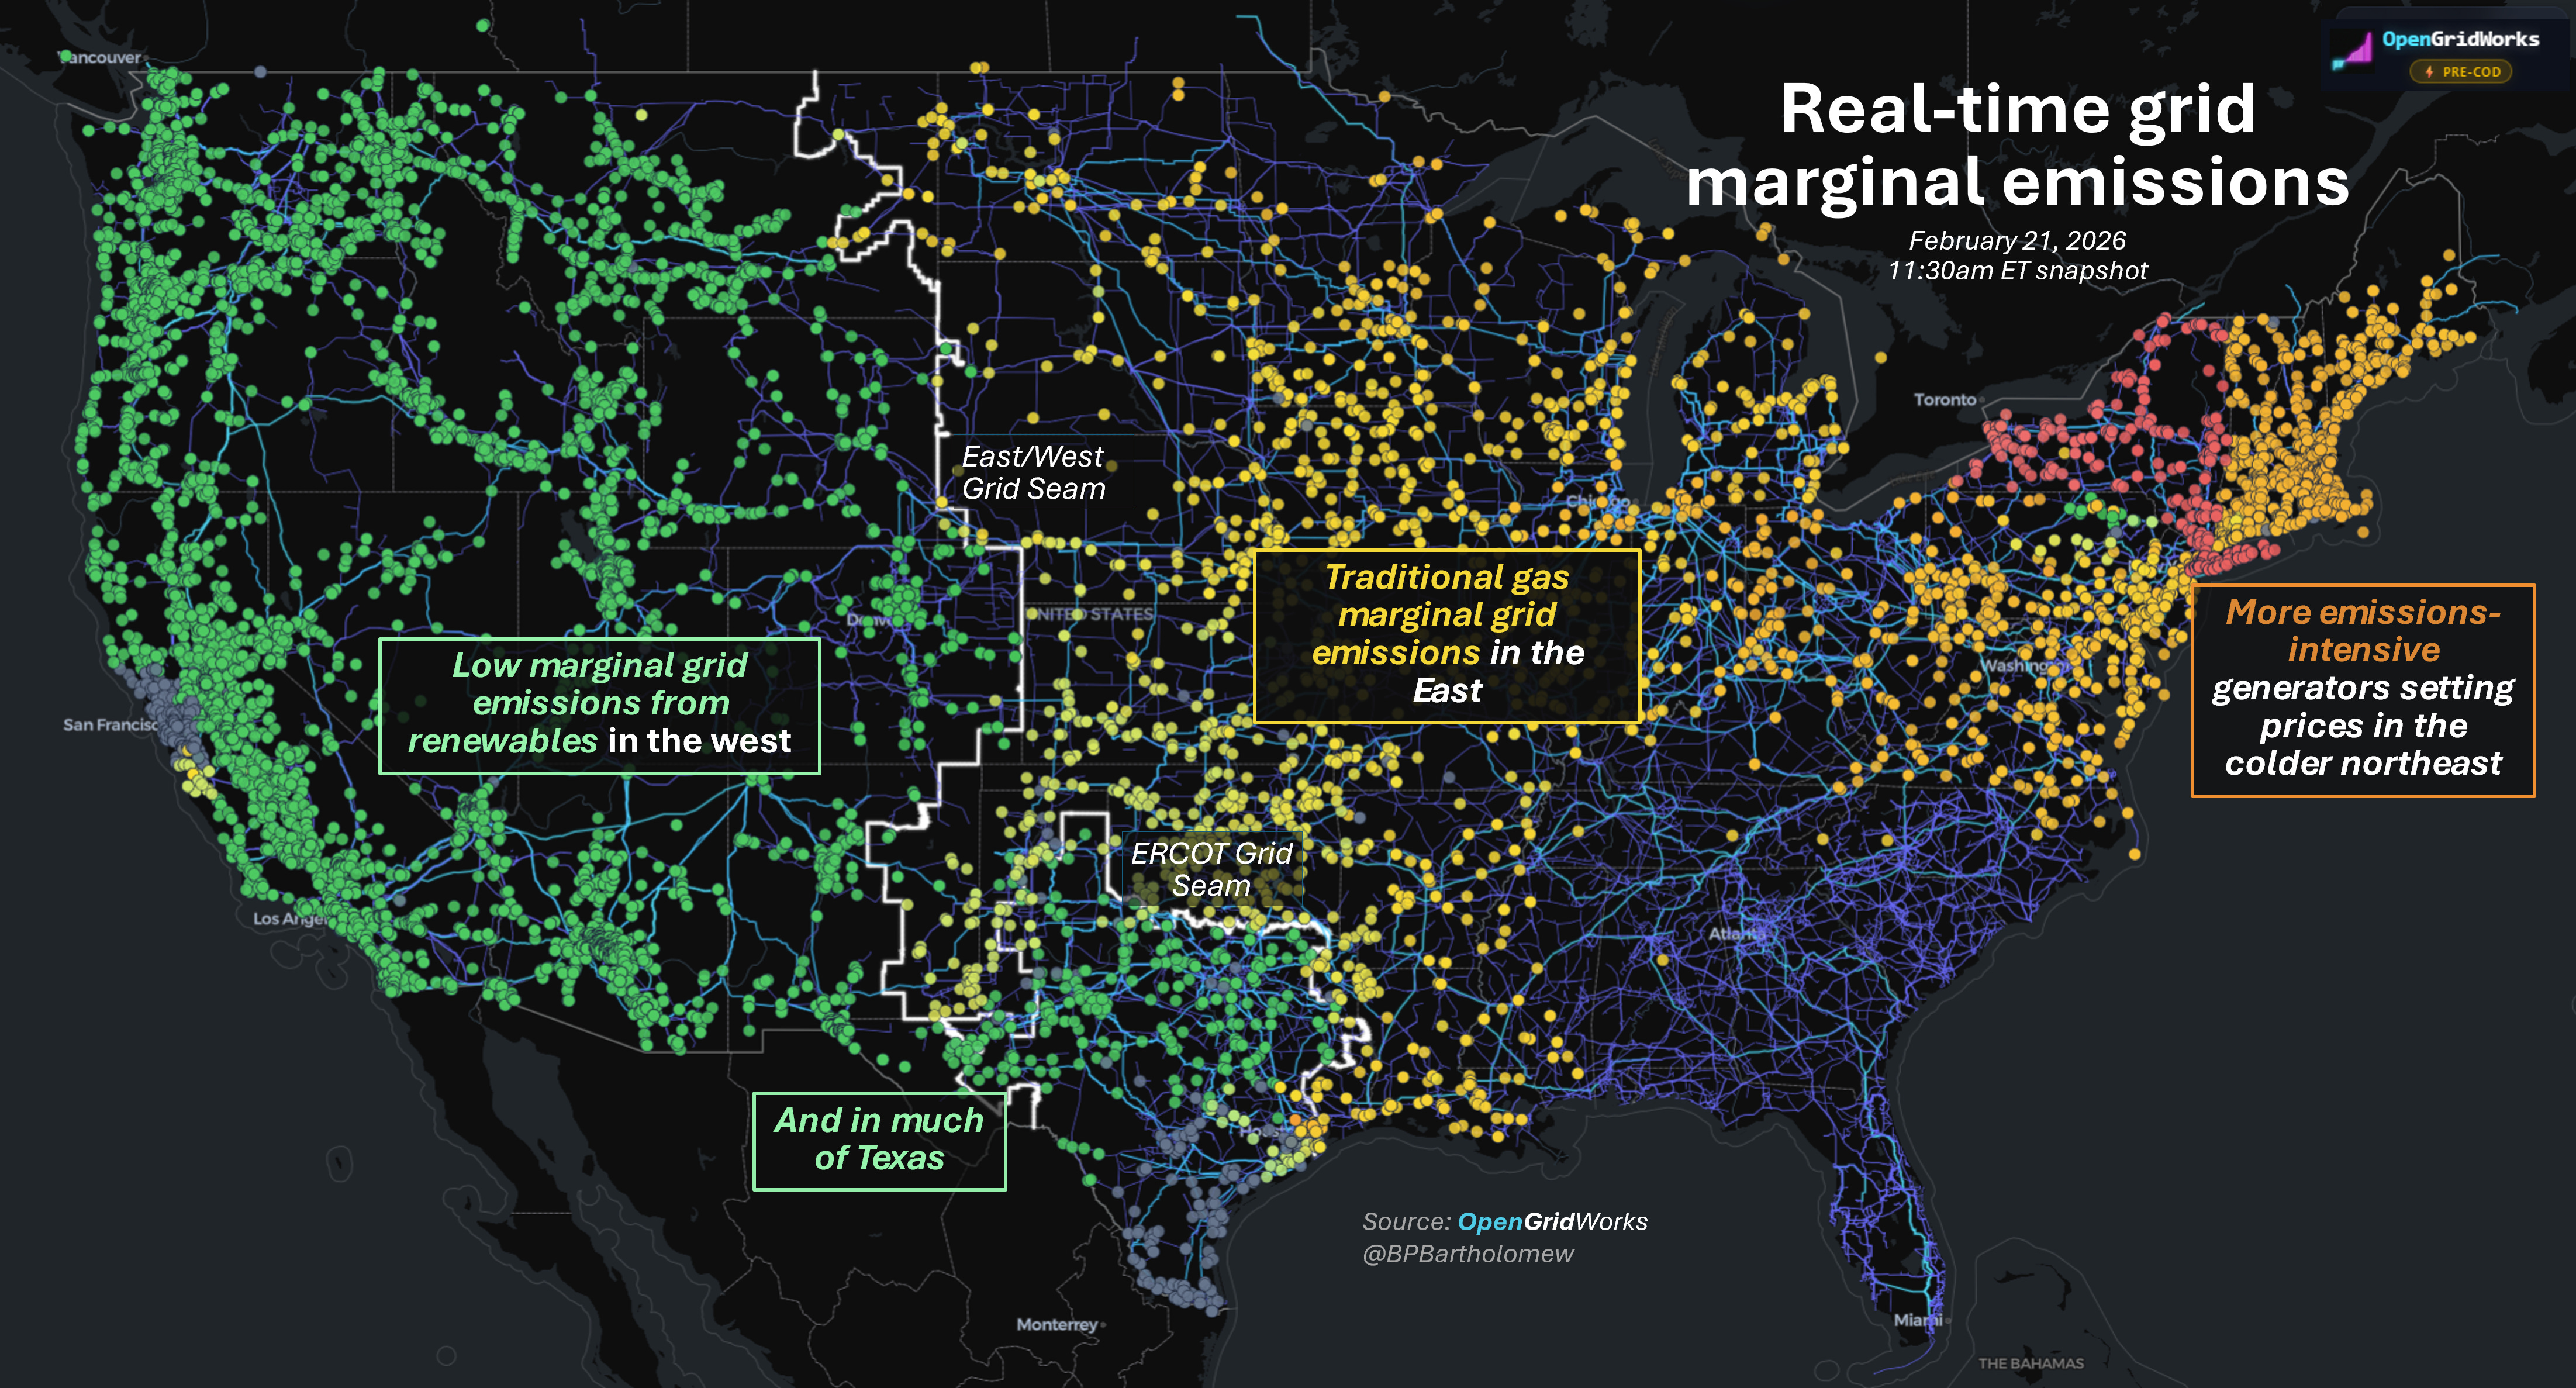
From an emissions perspective, marginal electricity demand was much cleaner in Texas and the western interconnect this morning, and much dirtier in the east.
The odd couple
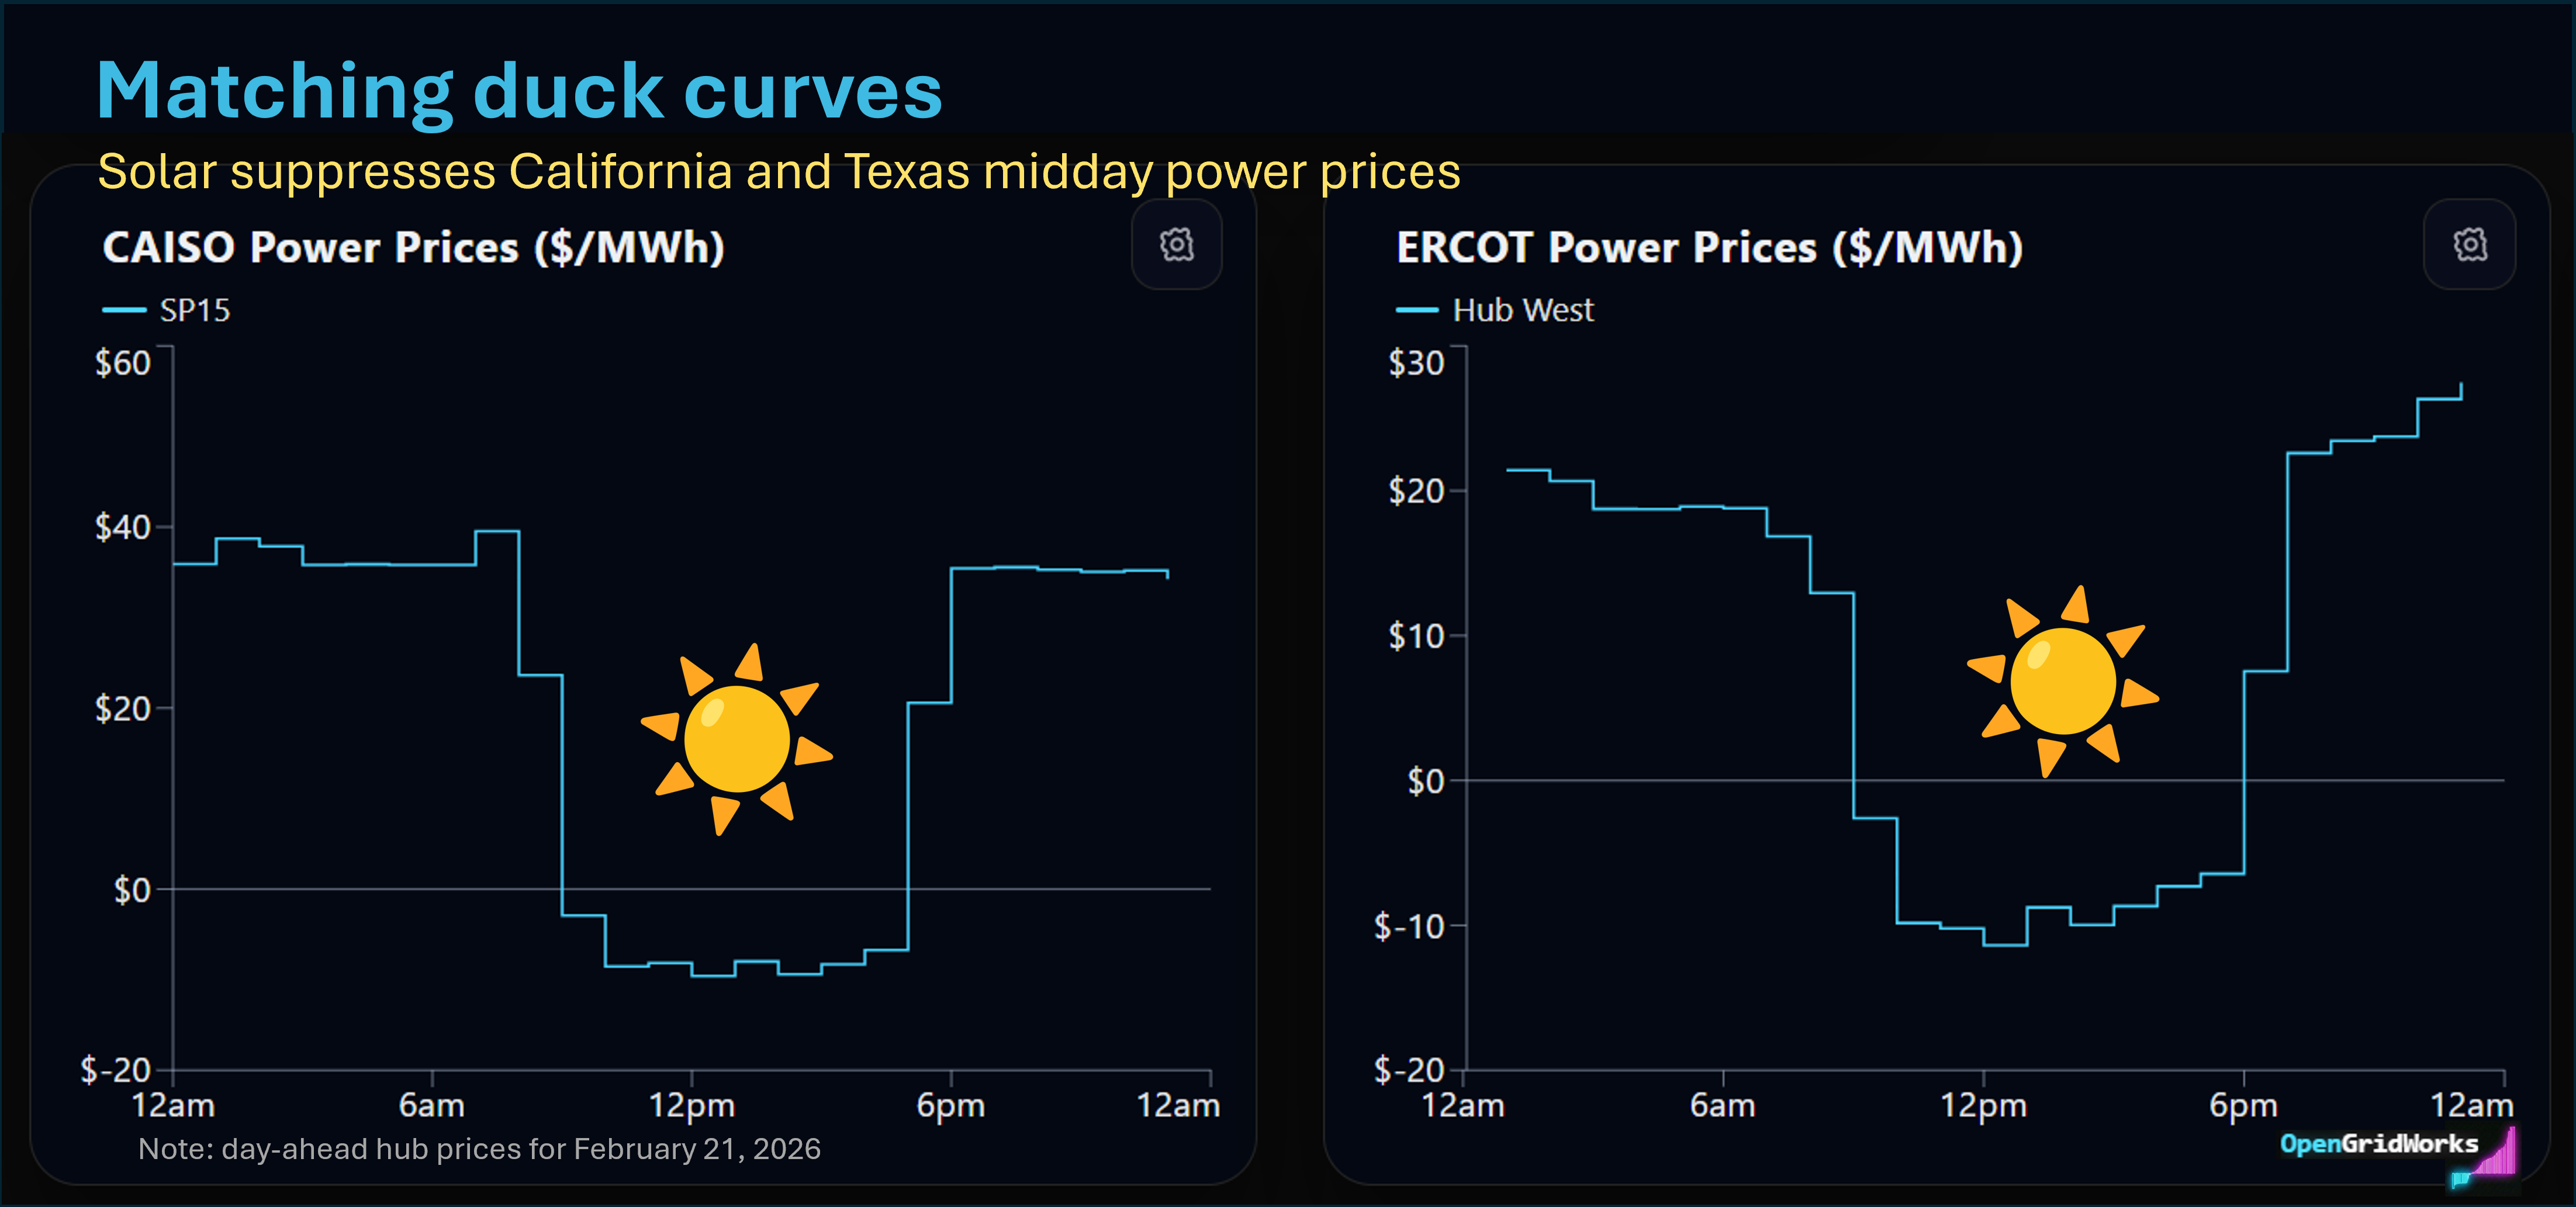
CAISO and ERCOT now look strikingly similar on mild spring mornings, with 20GW+ gluts of solar generation and gigawatts of batteries soaking it up.
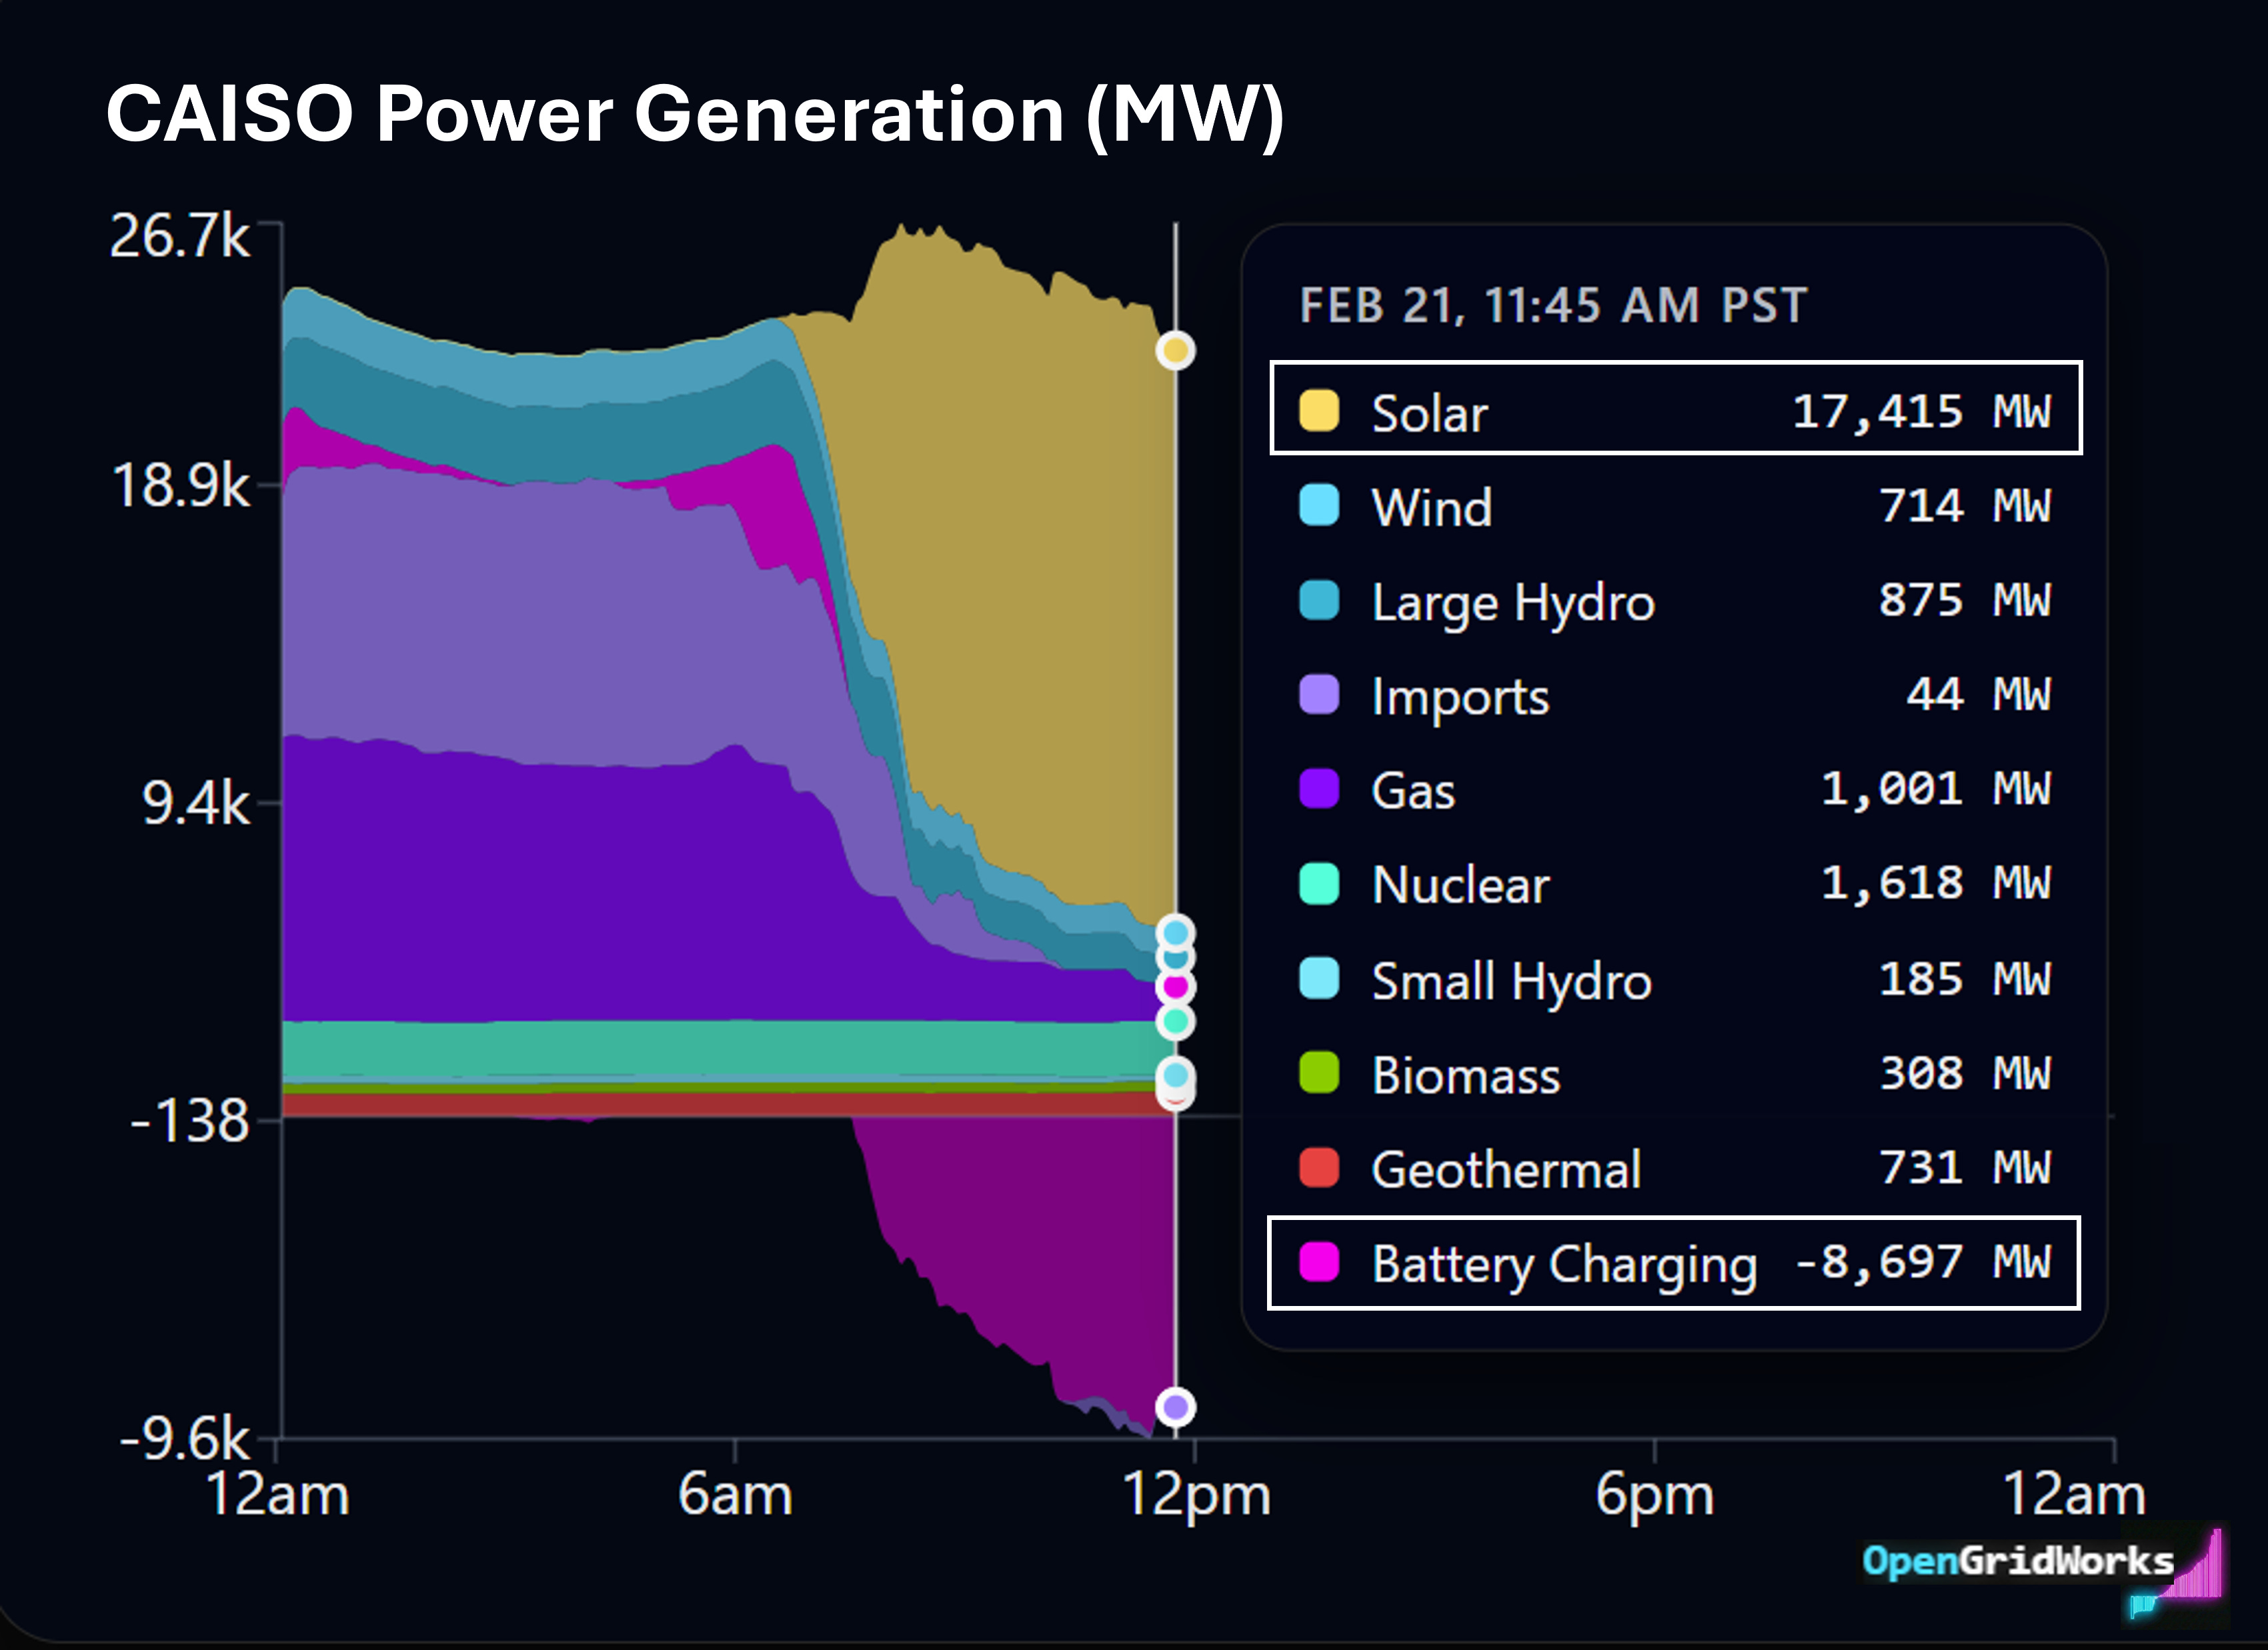
ERCOT is generating more grid-scale solar than CAISO these days, and this morning solar is the biggest single source of Texan power.
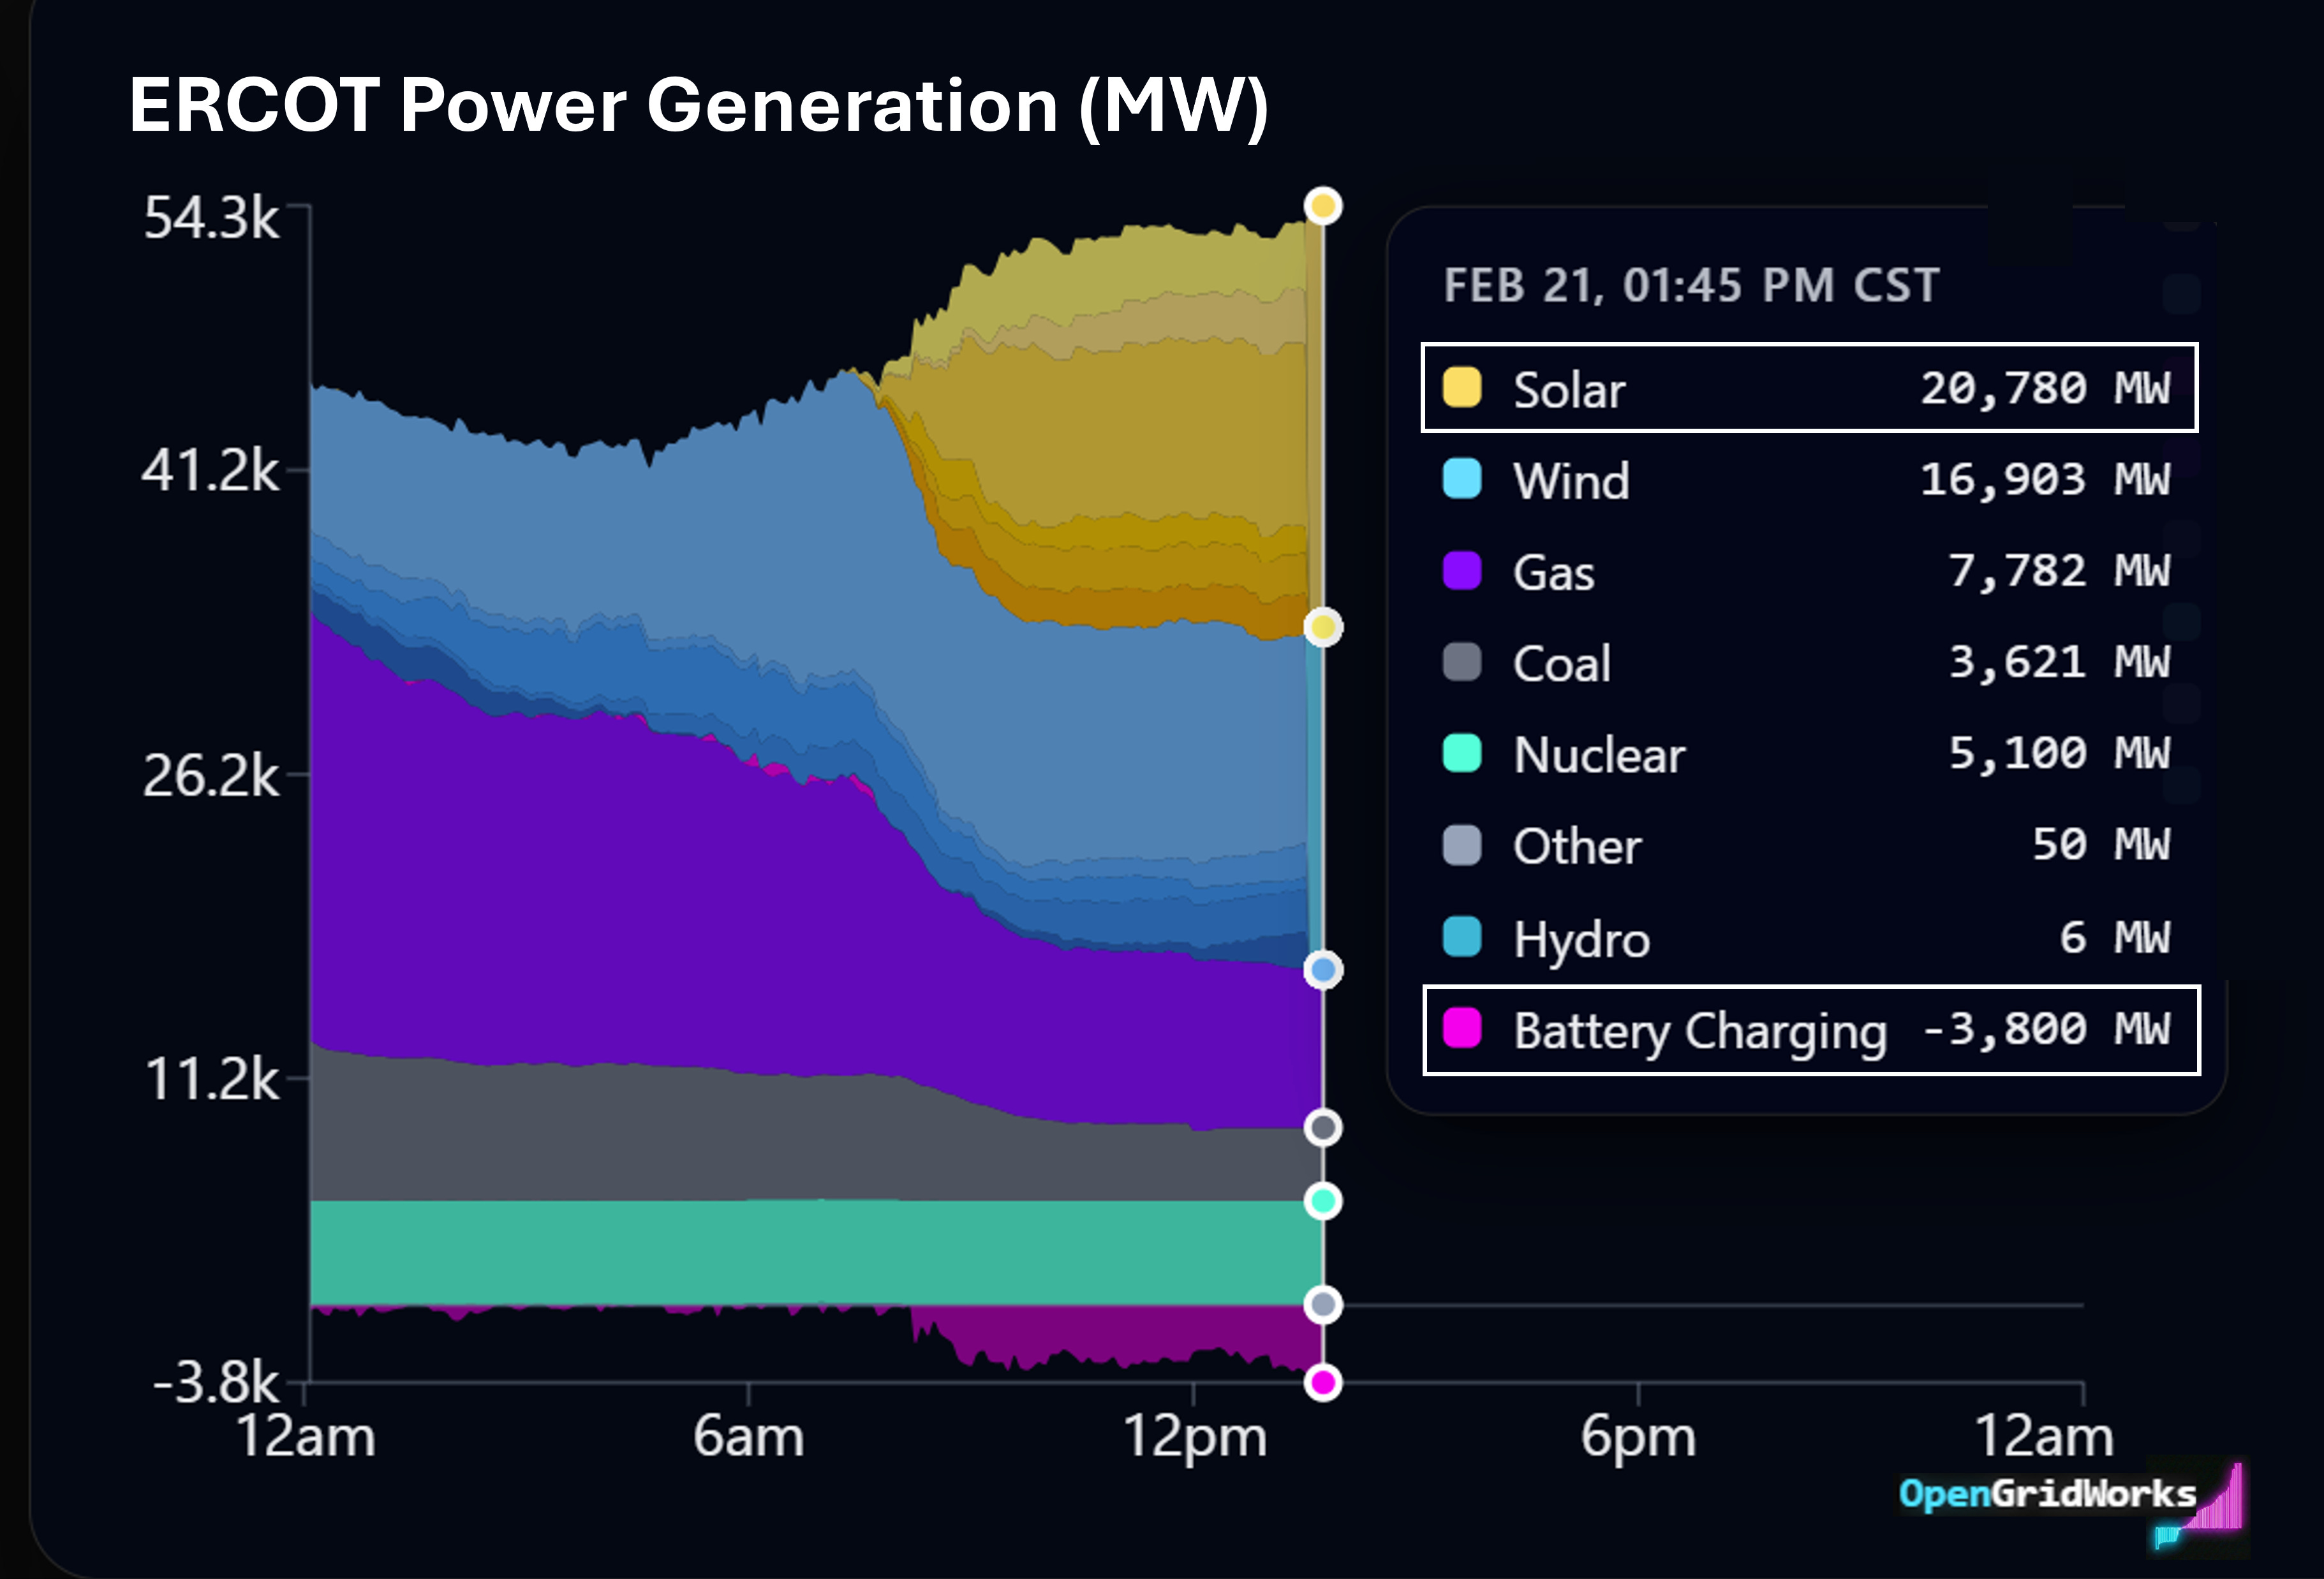
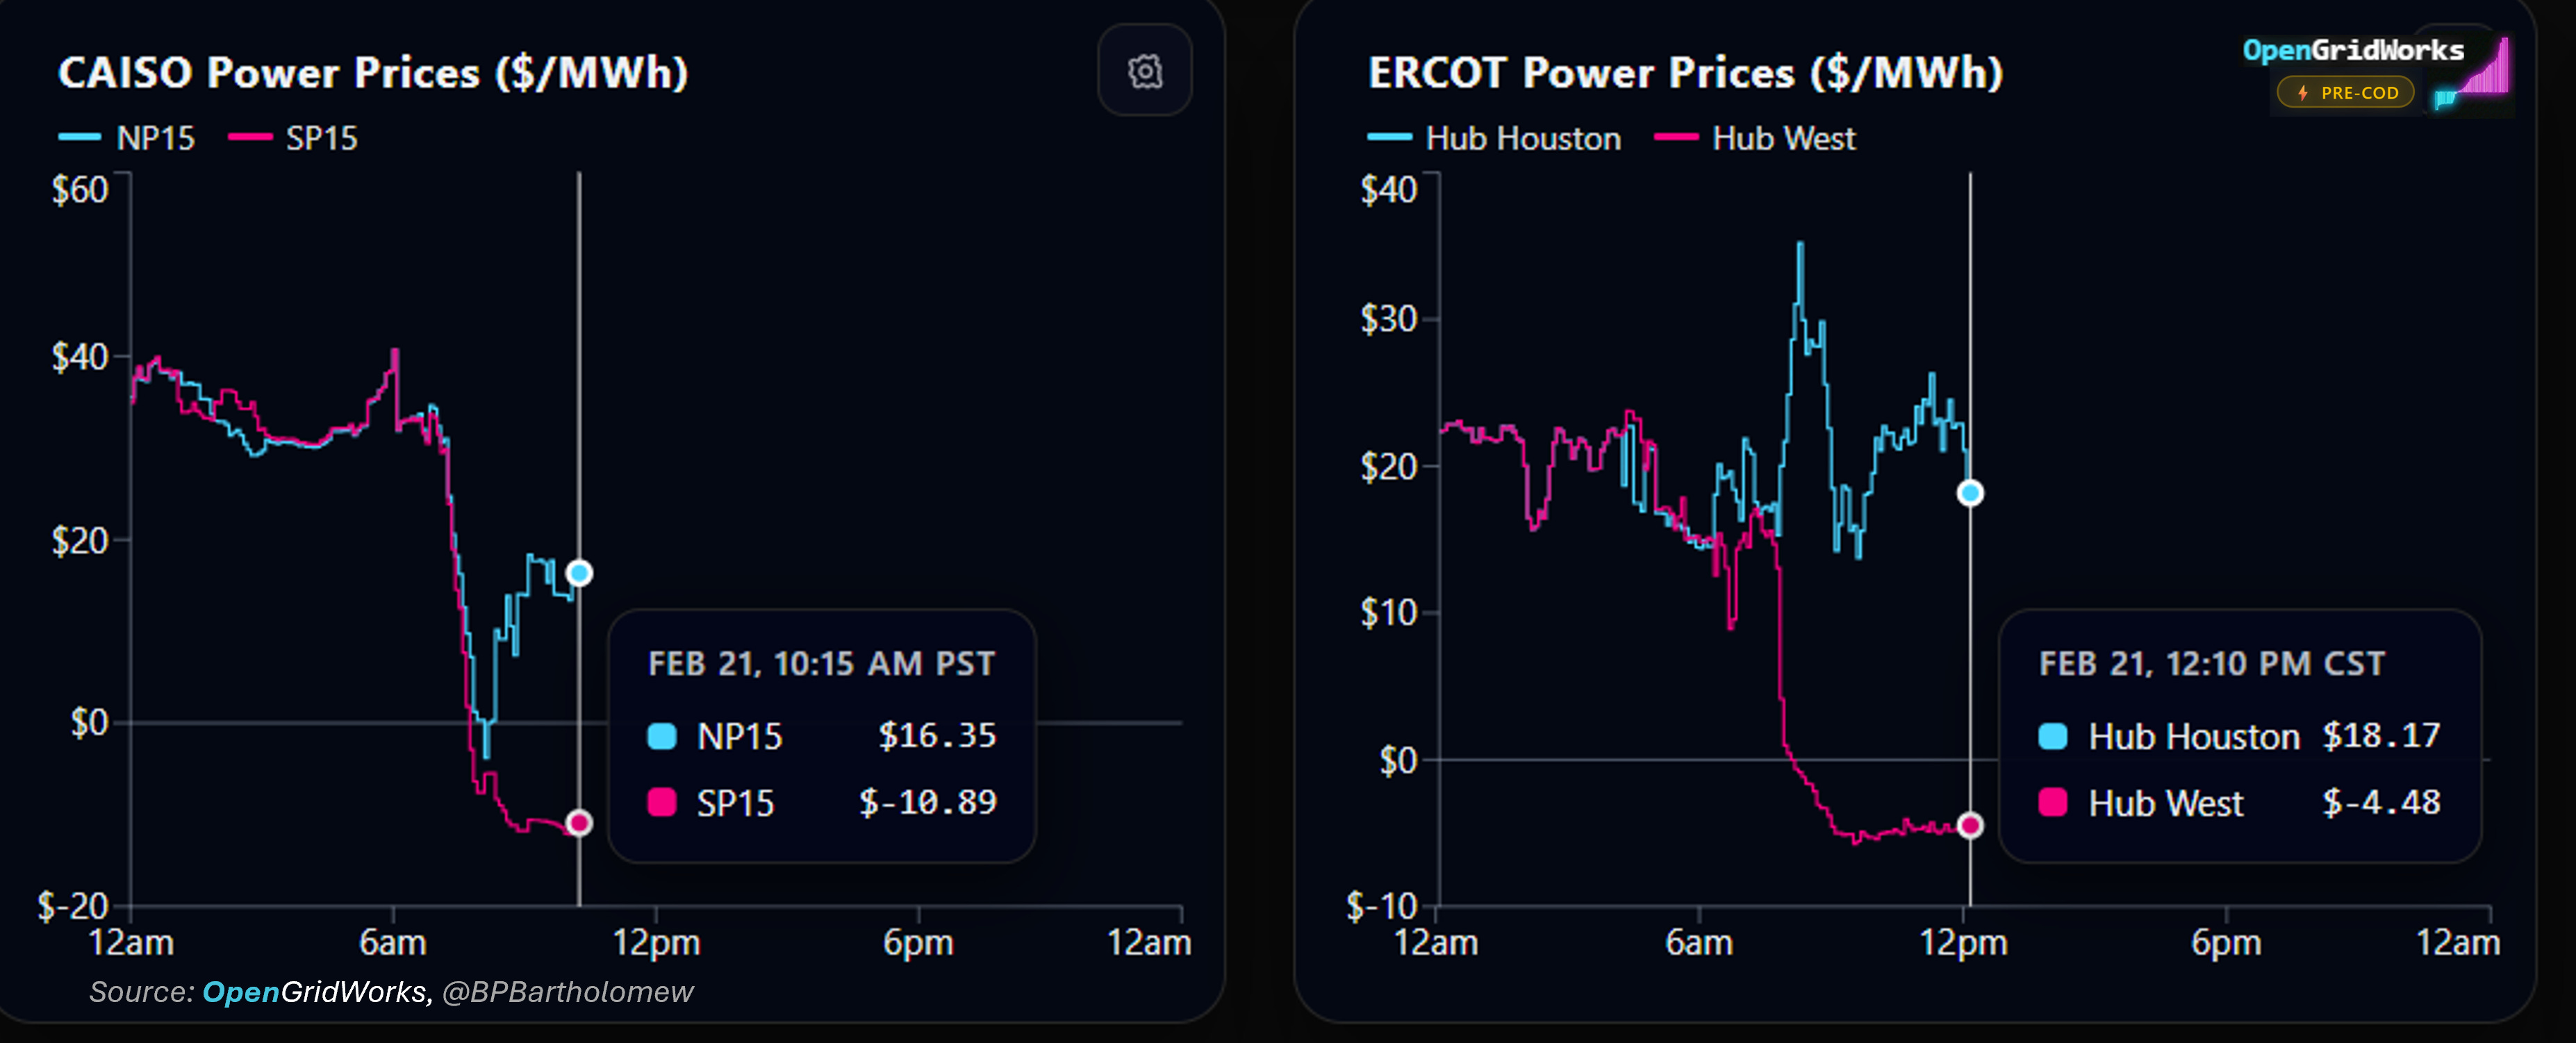
Both markets have matching ‘duck curves’ with negative pricing in their renewable rich regions today. Solar is hollowing out daytime prices and pricing more expensive generation out of the market.
Meanwhile, transmission constraints are creating two different pricing regimes within each region.
Hope you’re generating on the high side and charging on the low!
I’m excited to be posting again, and I’m aiming to make lots of publicly available grid data and charts that spark joy.
More to come here.
Have a great weekend,
Brian