Coming Soon: California Duck Curve, How Low Can You Go?
Solar saturation reshapes California power prices, signals for flexibility
Post Preview:
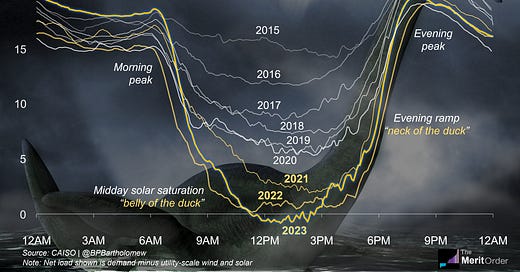
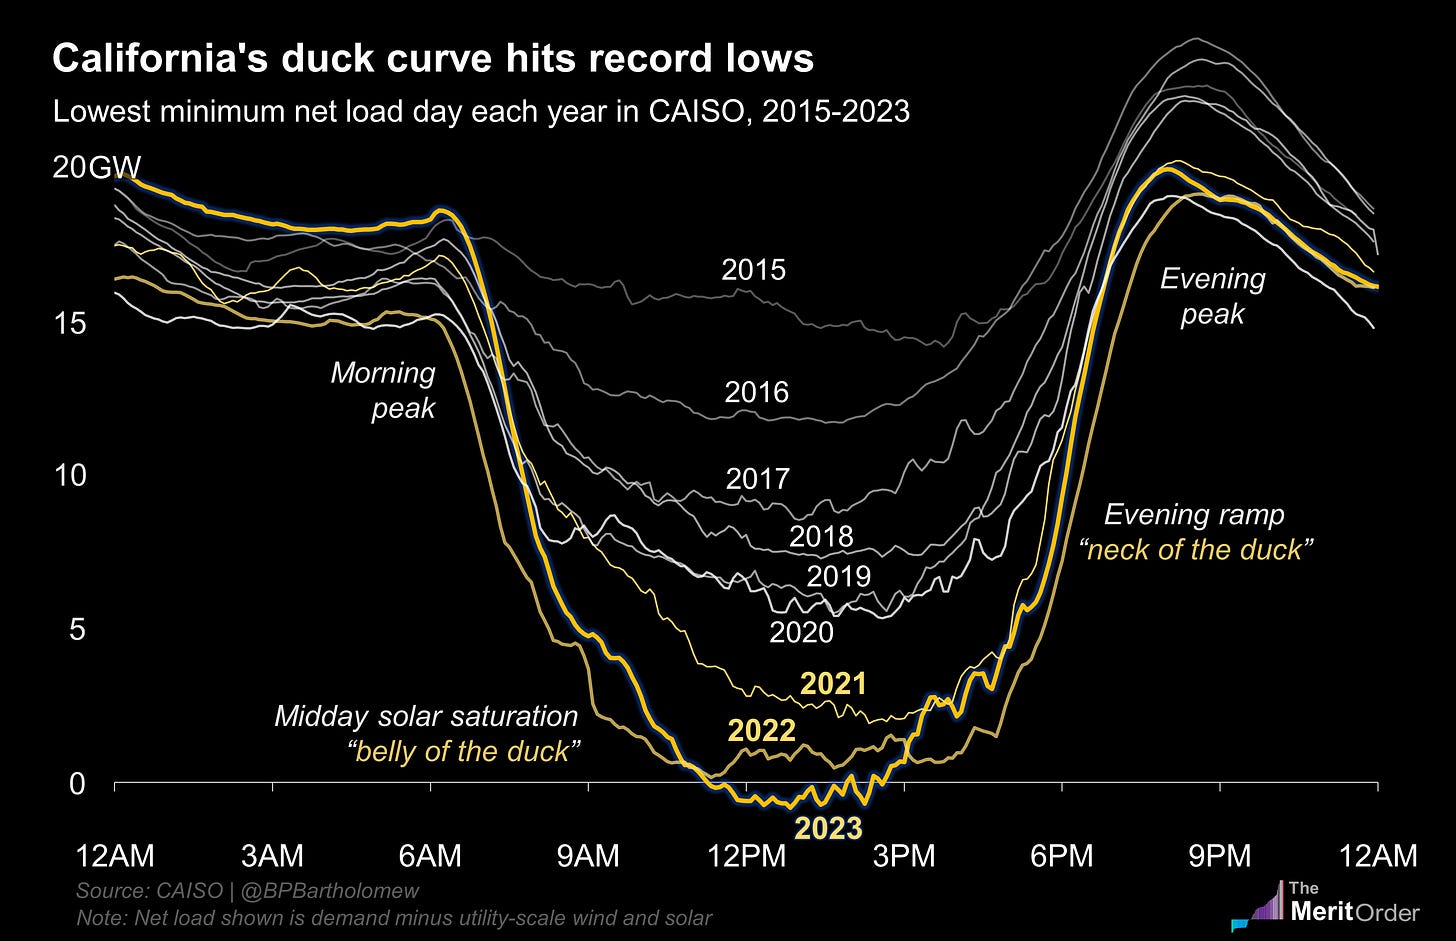
The duck curve describes the shape of ‘net demand’—residual demand that must be met by mostly fossil resources after ‘netting’ out energy produced by renewables.
The duck curve in California captures the challenge of ramping down conventional units for the grid soak up abundant solar midday (the “belly” of the duck) and then rapidly ramping those resources back up to meet demand as the sun sets (the “neck” of the duck).
It is unclear, and perhaps unlikely, if the person who coined this term has ever seen a duck.
Duck curve dynamics
A decade after its inception, the California duck curve is fully realized, producing a grid that features price droughts during solar oversupply, spikes when the sun sets, and a realignment of value prizing flexibility over the traditional metric of low marginal cost.
California’s duck curve is becoming a whole different animal
On the sunniest spring days, the belly of the duck is now distended down to the trough of the chart, while the neck is as high as ever.
The result is great for batteries (flexible), bad for gas (less flexible), and paradoxically ‘bad’ for solar itself, as it cannibalizes its own value.
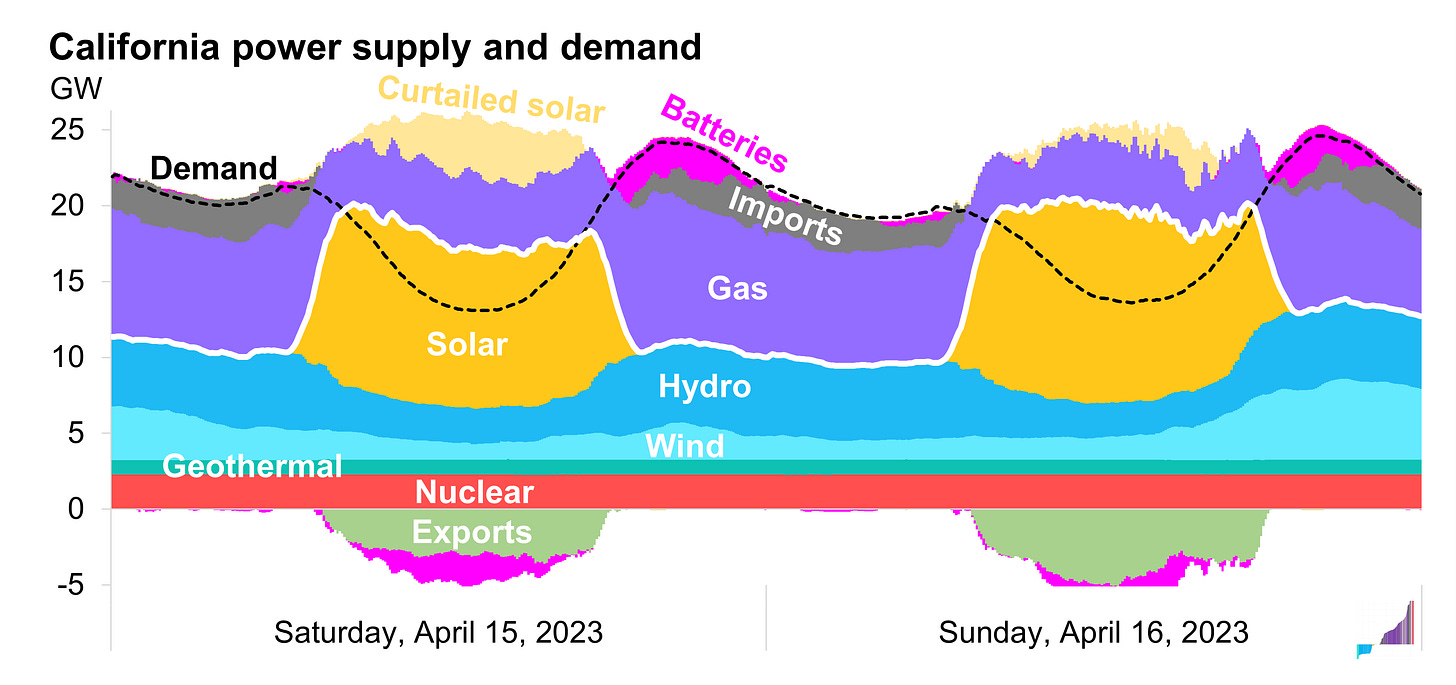
California midday spring power goes 100% clean
This is what it looks like these days. Solar generation soars midday. Gas flexes down. Some hydro flexes down, while some water must flow for fish and farmers. Imports flip to exports as spare solar energy finds on home on neighboring grids. Batteries are a growing source of flexibility.
As a result, California's largest grid operators now routinely produces more than 100% of demand from zero-emissions resources on the sunniest spring days.
Wasting the sun
Rather than flooding the grid, much of that solar energy is curtailed.


